I don’t know about you but I have always been confused about the group delay, phase delay, and sample delay in digital signal processing… Let’s clear this all up once and for all!
- What is a sample delay?
- What is a phase delay?
- What is a group delay?
- Why Is Constant Group Delay or Linear Phase Important?
- Summary
- Bibliography
What is a sample delay?
The first one to start off is the sample delay.
A system that delays the input by a constant number of samples introduces a delay to the signal.
Whenever you see the
Let’s look at an example.
Here, we have an example signal

Figure 1. Some signal.
What happens to it if we delay it by 4 samples?

Figure 2. Signal delayed by 4 samples.
As you can see at the output of the delay, the signal is simply delayed by 4 samples. We denote the delayed signal by
Remember that by the sample delay of a system, we refer to the delay of the whole signal by some number of samples between the output and the input. Pure delay elements, do not introduce any other change beyond the delay.
I have discussed the delay in samples in more detail in the following article & video.
What is a phase delay?
Let’s consider once again the output of the system delayed by 4 samples.

Figure 3. Signal consisting of 2 sines delayed by 4 samples.
This signal consists of 2 sines: one of them has period equal to 16 samples and the other one has period equal to 8 samples.

Figure 4. Sine with period of 16 samples.

Figure 5. Sine with period of 8 samples.
If you don’t know what the period of a signal is, it’s the smallest positive number of samples after which the signal starts repeating itself. For example, the “2-sine” signal repeats every 16 samples.
Both sines inside the signal were delayed by the same number of samples. But how did their phase advance?
The phase of a sine is a value in the
For the sine, whose period is 8 samples, 4 samples are half of its period. Therefore, 4 samples correspond to a shift of its argument (phase) by
However, for the sine, whose period is 16 samples, 4 samples are just one quarter of its period. Therefore, 4 samples correspond to a phase delay of
See? A delay in samples means different phase delays for different sines. To calculate the phase shift of a sine given its sample delay or vice versa, we need to know the period or the frequency of the sine.
How to Calculate the Phase Shift from the Transfer Function?
If we have the transfer function of a digital system or its frequency response
where
Example Phase Response Plot
Here is an example phase response plot. It is the phase response of the second-order Butterworth IIR lowpass filter with the cutoff frequency set to

Figure 6. Phase response of the second-order Butterworth IIR lowpass filter with the cutoff frequency set to
As you can see, this phase response is clearly nonlinear; in fact, all IIR filters have nonlinear phase.
Ok, we know what is the sample delay and the phase delay. Then, what is the group delay?
What is a group delay?
“Group delay” is probably the most misleading term in the history of DSP but I admit, it does make sense.
To understand the group delay let’s look at an example.
In a pure delay system, all frequency components at the input are delayed by a constant number of samples.
What if each frequency was delayed by a different number of samples?
To use our “2-sine” signal again, let’s say we delay the sine with the period equal to 8 samples by 4 samples and the sine with the period equal to 16 samples by 8 samples.
Here you can see the output of the described frequency-dependent delaying system.

Figure 7. Signal consisting of 2 sines delayed with a frequency-dependent delay.
Looking at the sines separately, at the output of this system the delayed sines look as follows.

Figure 8. Sine with period of 16 samples delayed by 8 samples (phase delayed by

Figure 9. Sine with period of 8 samples delayed by 4 samples (phase delayed by
What is interesting, now both sines have the same phase delay,
As you might guess at this point, the group delay is exactly the number of samples by which a single frequency component is delayed.
In our example, the group delay of the frequency corresponding to period 8 is 4 and the group delay of the frequency corresponding to period 16 is 8.
In the previous example, where the whole input was delayed by 4 samples, you saw that if the group delay is constant for all frequencies, the system does not alter the waveform visually, it simply delays it; we get a delay system as in the definition of the sample delay.
So constant group delay is equivalent to sample delay.
How to Calculate Group Delay from the Phase Delay?
Group delay can be easily calculated from the phase delay of the system
where
is the complex frequency response of the system, is its phase response, and denotes the derivative with respect to the angular frequency in radians per sample ( , where is a frequency in Hz and is the sampling rate).
Example 1: Linear phase=constant group delay
Let’s look at an example of a constant-group delay filter.
Here is the phase response of our delay by 4 samples.

Figure 10. Wrapped phase response of a 4-sample delay system.
You can see that the phase is wrapped: when it reaches
If we unwrap the phase, the phase response looks as follows.

Figure 11. Unwrapped phase response of a 4-sample delay system.
By the way, these plots were obtained using scipy.signal.freqz, numpy.angle, numpy.unwrap, and the matplotlib library 🙂
The derivative of the phase response with respect to the frequency is simply the tilt coefficient of this linear function. In this case, the derivative is constant at each frequency
Note: You can also calculate the group delay from the analytical form of the phase response. In the case of a pure delay of 4, the frequency response is
Example 2: Nonlinear phase=non-constant group delay
Here is the plot of the group delay of the second-order Butterworth IIR lowpass filter with the cutoff frequency set to
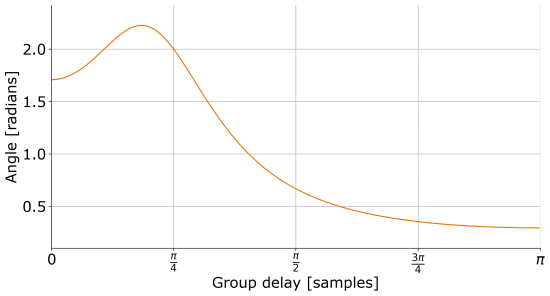
Figure 12. Group delay of the second-order Butterworth IIR lowpass filter with the cutoff frequency set to
This group delay was calculated with the scipy.signal.group_delay function.
As you can see, a nonlinear phase response resulted in a non-constant group delay.
Where Does the Term “Group Delay” Come From?
The group delay takes its name from the continuous frequency domain. Mathematically speaking, group delay describes the time delay of an infinitesimally small range of frequencies around some particular frequency
Why Is Constant Group Delay or Linear Phase Important?
If a system has linear phase, it means that its phase response is a linear function of angular frequency, typically of the form
If a system has linear phase, it has constant group delay
Well, if a system has a constant group delay, then it means that it does not alter the input waveform visually; its behavior can be represented as a frequency-dependent amplitude scaling and a frequency-independent delay.
Why is it important? Well, as you could see for the 2 sines example, the change in the outlook of the signal can be drastic. Also such drastic changes make the outcome less predictable when we start mixing multiple signals together. If the group delay is not constant we may run into phase cancellation issues.
That’s why we typically (but not always) prefer linear phase (=constant group delay) systems.
Unfortunately, only finite impulse response (FIR) filters can have linear phase and, thus, linear-phase systems introduce significant delay… But that’s a topic for another article 😎
Summary
In this article, you learned what is sample delay, phase delay, and group delay. You now know what is the difference between these three.
You also learned that systems (filters) with linear phase have constant group delay so their effect on the system can be described by a frequency-dependent gain and a frequency-independent delay in samples. Systems with linear phase are more predictable and, thus, more desirable.
With this knowledge you won’t be confused again when you stumble upon one of these “delay” terms!
If you want to know which other bits and pieces of knowledge are necessary for writing software that processes sound, check out my free Audio Plugin Developer Checklist!
Bibliography
[OppenheimSchafer10] Alan V Oppenheim, Ronald W. Schafer, Discrete-Time Signal Processing, 3rd Edition, Pearson 2010.
Comments powered by Talkyard.